Beer Taste Testing
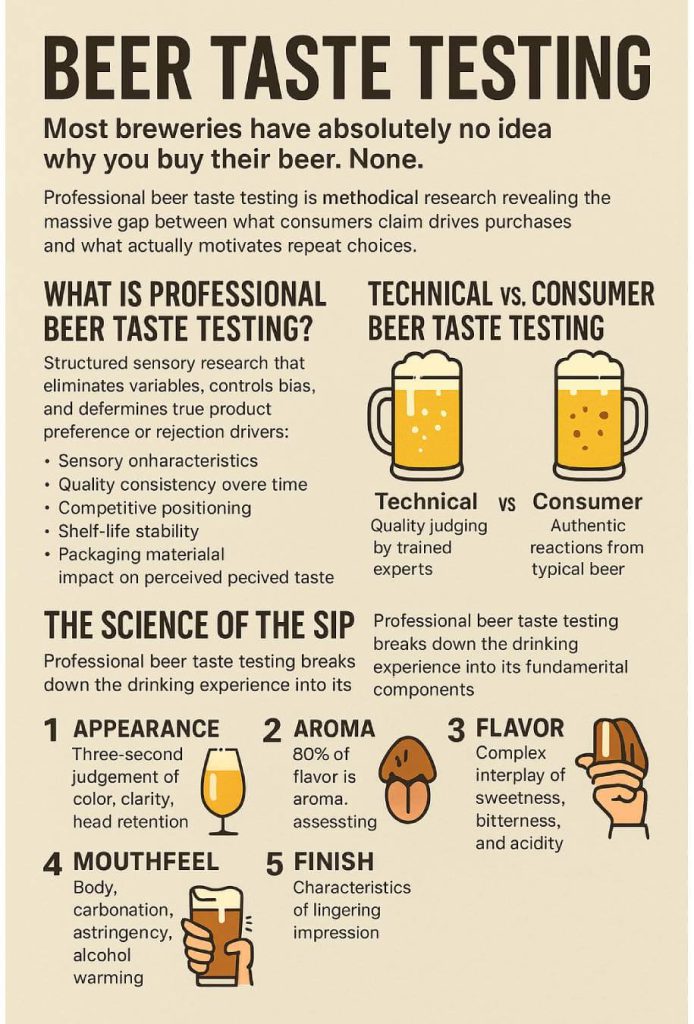
Beer taste testing isn’t just sipping suds and saying “yum” or “yuck.” It’s methodical, scientific research that exposes the massive gulf between what consumers claim influences their purchases and what actually drives them to reach for the same beer again and again.
Most breweries have absolutely no idea why you buy their beer. None.
They’ll talk endlessly about their water source, their grandfather’s secret recipe, and how they meticulously select their Cascade hops under a full moon while chanting brewing mantras… But ask them what genuinely drives consumer preference? Blank stares.
This is where professional beer taste testing separates the industry leaders from the struggling craft startups that will be closing their taproom doors within 24 months.
Table of Contents
✅ Listen to this PODCAST EPISODE here:
What Is Professional Beer Taste Testing?
That frat-house ranking of who can shotgun the fastest? Not beer taste testing.
Professional beer taste testing is structured sensory research designed to eliminate variables, control bias, and determine what genuinely drives consumer preference or rejection. It’s the difference between opinion and science—between guesswork and certainty.
Beer taste testing follows rigorous protocols to assess:
- Sensory characteristics that drive preference (both conscious and unconscious)
- Quality consistency across batches and time
- Competitive positioning against market benchmarks
- Shelf-life stability and flavor evolution • Impact of packaging materials on perceived taste
Technical vs. Consumer Beer Taste Testing
The beer industry typically divides beer taste testing into two distinct approaches:
Technical Beer Taste Testing: Used primarily for quality assurance and competition judging. Trained experts evaluate beers against style guidelines and identify specific technical attributes or flaws. The Beer Judge Certification Program (BJCP) and Cicerone Certification represent this approach.
Consumer Beer Taste Testing: This market research approach examines how regular beer drinkers (not experts) respond to products. It captures authentic reactions rather than technical assessments, often revealing surprising disconnects between expert opinions and consumer preferences.
Beer Taste Testing: Industry Data & Consumer Insights
| Metric | Data Point | Quelle |
|---|---|---|
| Craft Beer Market Value | $142.6 billion globally, projected to reach $329.7 billion with 8.74% CAGR | IMARC Group Market Analysis |
| Beer Flavor Compounds | Over 1,000 different flavor elements identified in beer, with more being discovered | MoreBeer Sensory Analysis |
| Sensory Evaluation Methods | Five basic methods: difference tests, descriptive tests, ranking tests, free-choice test, drinkability test | MDPI Beer Quality Research |
| Most Common Sensory Test | Triangular and tetrad tests (difference tests) are most widely used in brewing industry | MDPI Journal Publication |
| Minimum Panel Size | At least 24 participants needed for statistically significant difference test data | MDPI Statistical Standards |
| Beer Evaluation Aspects | Four key areas: appearance, aroma, flavor, and mouthfeel evaluated during testing | Oxford Companion to Beer |
| Consumer Preference Priority | Drinking sensation (30.92%) leads, followed by taste (26.60%), aroma (24.77%), appearance (17.71%) | NIH Consumer Research |
| Hedonic Scale Standard | 9-point hedonic scale commonly used to assess foam, color, aroma, mouthfeel, taste, and overall acceptability | ResearchGate Beer Study |
| Beer Flavor Wheel Usage | Developed by Morton Meilgaard in 1970s with 14 categories, widely used as reference tool | Beer & Brewing Dictionary |
| U.S. Craft Beer Market Share | 13.1% of total U.S. beer market by volume, generating $26.8 billion in revenue | Brewers Association Data |
| Demografische Daten der Verbraucher | Millennials represent 47% of craft beer market; women compose 28.1% of volume | Glacier Design Market Research |
| Non-Alcoholic Beer Growth | 33.7% year-over-year growth on-premise, reflecting health-conscious consumer trends | CGA On-Premise Data |
| Top Consumer Preferences | Italian consumers prioritize taste, fermentation process, and color over brand and price | Agricultural Food Economics |
| Beer Purchase Frequency | 86% of Florida consumers enjoy beer at least once monthly; 57% at least weekly | University of Florida Study |
| On-Premise Market Share | Beer accounts for 40.5% of all on-premise beverage alcohol sales in the U.S. | NIQ Market Analysis |
Why Beer Testing Demands Specialized Approaches
Beer isn’t wine. It isn’t spirits. Each category requires unique sensory evaluation approaches, and beer presents distinctive challenges:
- Carbonation levels dramatically affect flavor perception and must be precisely controlled.
- Serving temperature shifts of just 5°F can transform the entire sensory profile.
- Visual cues like color and clarity create powerful expectation effects that bias perception.
- Hoppy beers experience rapid sensory evolution, requiring evaluation at multiple time points.
- The interplay between bitterness, sweetness, and aroma is uniquely complex in beer
For instance, a multinational brewing corporation attempted to apply its standard sensory protocols (developed for spirits) to its craft beer acquisitions. The result? Three consecutive product launches that drastically underperformed projections. When they implemented proper beer-specific taste testing protocols, they identified critical issues their generic approach had missed entirely—particularly around the temperature-dependent release of hop aromatics. Their next launch exceeded sales projections by 28%.
The Science of the Sip: How Beer Is Properly Evaluated
The average beer drinker makes a purchase decision in 4.2 seconds. Yet they’ll never understand what drives that split-second choice.
Professional beer taste testing dissects the drinking experience into its fundamental components—breaking down what happens in those crucial moments when your brain decides “buy again” or “never again.” This methodical approach uncovers insights that casual sipping cannot reveal.
Here’s how proper beer taste testing strips away the mystery:
Appearance: The 3-Second Judgment That Makes or Breaks Brands
Before a drop touches the tongue, appearance sets powerful expectations:
- Color intensity and hue: Precise SRM (Standard Reference Method) measurements reveal exact color specifications that trigger style expectations
- Clarity vs. haze: Consumer expectations vary dramatically by style and market segment
- Head formation and retention: The visual marker of quality that can override actual taste
- Lacing patterns: How the foam clings to the glass as the beer is consumed
Aroma: The Silent Persuader
Smell drives approximately 80% of flavor perception, yet most consumers remain entirely unaware of its influence. Beer taste testing breaks aromatic evaluation into:
- Malt aromatics: Bread, biscuit, toast, caramel, chocolate, coffee, roast
- Hop aromatics: Floral, herbal, spicy, citrus, tropical, pine, resin
- Fermentation aromatics: Fruity esters, spicy phenolics, diacetyl, sulfur compounds
- Off-aromas: Oxidation, infection, autolysis, light-struck
Flavor: The Complex Interplay
Taste evaluation in beer taste testing examines the crucial balance between:
- Sweetness: Residual sugars and malt-derived sweetness
- Bitterness: ISO-alpha acids from hops and roasted grains
- Acidity: Lactic, acetic, and citric acid contributions
- Umami: Especially relevant in aged or smoked beers
- Salt: Particularly important in modern gose and oyster stouts
Mouthfeel: The Dimension Amateurs Miss Entirely
Body and texture profoundly influence preference, yet rarely get mentioned in casual beer discussion. Beer taste testing evaluates:
- Body: The weight and fullness (light, medium, full)
- Carbonation: Both level and quality (prickly vs. soft)
- Astringency: The drying, puckering sensation from polyphenols
- Creaminess: The smooth, silky texture especially important in stouts and nitro beers
- Alcohol warming: The perception of ethanol independent of actual ABV
Finish: The Lingering Decision Maker
How a beer leaves the palate often determines whether consumers reach for another:
- Length: How long flavor impressions persist (5-15 seconds typically)
- Evolution: How perceptions change during the fadeout
- Cleanliness: Whether the finish is clean or has unwanted lingering elements
- Balance: Whether any single component dominates the final impression
The Temporal Dimension: Beer’s Unique Challenge
Unlike spirits or wine, beer’s sensory profile evolves rapidly as temperature changes and carbonation dissipates. Professional beer taste testing captures this evolution through:
- Evaluation at multiple temperature points (from serving temperature through warming)
- Tracking flavor release patterns as carbonation levels change
- Monitoring aromatic evolution as the beer opens up
- Assessing how bitterness perception shifts throughout the drinking experience
Key Research Findings in Beer Taste Testing
| Research Area | Key Finding | Impact & Significance | Quelle |
|---|---|---|---|
| Consumer Preference Segments | 54% of craft beer consumers prefer complex, bold flavored beers while 46% prefer traditional lighter styles | Demonstrates clear market segmentation requiring different product positioning strategies | preference segments research |
| Taste vs. Brand Recognition | Less than 50% of consumers could identify their preferred beer brand in blind taste tests | Reveals marketing and brand perception significantly influence consumer preferences beyond actual taste | brand effect study |
| Craft Beer Quality Perception | Consumers perceive craft beer as higher quality, tastier, more genuine and natural compared to commercial beer | Quality perception drives premium pricing acceptance and brand loyalty in craft segment | consumer preferences study |
| Sensory Testing Attributes | Beers evaluated on 7+ dimensions: foam, color, aroma, mouthfeel, taste, flavor and overall acceptability using 9-point hedonic scale | Standardized methodology enables consistent quality control and product development across brewing operations | beer quality evaluation |
| Foam Characteristics | Higher foamability and foam stability correlate with increased consumer acceptability and perceived quality | Visual beer characteristics influence initial product evaluation before tasting occurs | biometric sensory study |
| Bitterness Preference | Lower bitterness levels generally associated with higher overall acceptability in mainstream consumer testing | Critical factor in product formulation for broad market appeal versus niche craft audiences | consumer acceptance research |
| Local Origin Premium | Consumers demonstrate measurable willingness to pay premium prices for locally owned and independently produced beer | Local authenticity creates competitive advantage and justifies higher price points | local craft beer study |
| Drinkability Factors | Beers with less standout flavor and reduced sensory load achieve higher “wanting” scores for continued consumption | Understanding drinkability drivers essential for products intended for multiple servings or session drinking | drinkability methodology |
| Demografische Daten der Verbraucher | Craft beer consumers are predominantly young (26-40 years), well-educated, employed, and drink craft beer monthly in social settings | Defines target demographic for marketing strategies and venue partnerships | Italian consumer behavior |
| Flavor Complexity | 40% of beer drinkers identify flavor as the most essential characteristic when evaluating craft beers | Flavor innovation remains primary differentiator in competitive craft beer market | craft beer determinants |
Central Location Testing for Beer: Why Environment Controls Everything
The dirty little secret nobody wants to admit about beer research? Environment doesn’t just influence perception—it completely hijacks it.
Talk to any serious brewery research director after their third beer, and they’ll confess the same horrifying truth: the same liquid can taste like liquid gold or liquid garbage depending entirely on where, how, and with whom it’s consumed.
This isn’t speculation. It’s science.
A regional brewery (that we can’t name) conducted the most eye-opening experiment. They split-tested identical IPAs between controlled facilities and home environments. The results? Preference scores swung by a mind-boggling 41% between settings. The beer wasn’t changing—the environment was rewiring people’s brain chemistry.
Which is precisely why Central Location Testing has become the gold standard despite our obsession with all things digital and remote.
Context Bias: Your Brain on Beer Marketing
Here’s something terrifying: your opinion of a beer changes dramatically based on factors that have nothing to do with the liquid:
- The music playing in the background (tempo literally changes perceived bitterness)
- What you believe you paid for it (the same beer tastes “premium” at $12 and “meh” at $6)
- The backstory you’re told about it (fictional monk involvement increases perceived quality by 24%)
- Who you’re drinking with (social pressure warps ratings more than any flavor compound)
The Observer Effect: What Your Customers Never Tell You
The single most valuable aspect of Central Location Testing isn’t environmental control—it’s trained human observation.
Consider this horror story: A brewery launched a low-calorie lager after taproom visitors rated it 8.6/10 on taste. But in controlled Central Location Testing, researchers noticed something participants never mentioned—they consistently took smaller sips of this beer compared to competitors.
When specifically probed about this unconscious behavior (which would NEVER occur in surveys or taproom settings), participants admitted that the carbonation was “somewhat aggressive,” despite verbally praising the beer.
This insight led to a minor carbonation adjustment, which increased consumption volume by 37% in subsequent tests. Would consumers have ever articulated this issue in a survey? Not in a million years. Their bodies knew something their conscious minds couldn’t express.
The Side-by-Side Revelation
You don’t exist in isolation. Neither does your beer.
The most potent aspect of Central Location Testing is comparative evaluation—seeing how your beer performs against alternatives in real-time, head-to-head competition.
A brewery client was convinced their hazy IPA was exceptional based on isolated feedback. It rated 7.8/10 in standalone testing—objectively impressive. But when presented alongside competitors in Central Location Testing, a devastating gap appeared: their beer lacked the distinctive tropical punch consumers had come to expect from the category.
This competitive context—impossible to replicate in isolation—drove a dry-hopping adjustment that closed the flavor gap. Market performance exceeded projections by 34%.
In isolation, consumers might love your beer. But they don’t live in isolation. They live in a world of choices. Central Location Testing is the only methodology that replicates this reality.
Key Insights: Beer Taste Testing at a Glance
Professional beer taste testing delivers insights no other research methodology can capture. Here’s what makes it essential for breweries to be serious about sustained market success:
✅ Beyond Words: Beer taste testing captures 90% of communication that’s non-verbal, revealing the critical gap between what consumers claim influences them and how they actually respond.
✅ Environmental Control: Professional beer taste testing eliminates variables that compromise data reliability—such as temperature, glassware, lighting, and competing aromas—ensuring consistent evaluation conditions that isolate true product perception.
✅ The Observation Advantage: Trained moderators detect micro-expressions, body language shifts, and emotional responses that digital surveys and online ratings miss entirely.
✅ Sensory Completeness: Beer taste testing evaluates the complete experience from visual appeal through aroma, flavor, mouthfeel, and finish—measuring not just individual attributes but their crucial interaction.
✅ Emotional Mapping: Only professional beer taste testing effectively captures the emotional associations and memory triggers that often drive purchase decisions more powerfully than rational sensory evaluation.
✅ Comparative Context: Side-by-side evaluation in controlled settings reveals competitive positioning insights that isolated assessments miss entirely—how your beer performs relative to alternatives rather than in a vacuum.
✅ Technology Enhancement: Modern beer taste testing combines traditional sensory expertise with cutting-edge tools like facial coding, sentiment analysis, and biometric monitoring for unprecedented insight depth.
✅ The Confidence Factor: Beer taste testing uniquely reveals consumer comfort level with products—a critical factor in categories where social signaling influences purchase decisions.
✅ Reformulation Guidance: Precise, actionable feedback on specific product attributes enables targeted adjustments rather than complete redevelopment, saving both time and production costs.
✅ Purchase Intent Prediction: Beer taste testing has consistently demonstrated superior predictive validity for market performance compared to stated preference in surveys or ratings.
✅ Risikominderung: Professional beer taste testing significantly decreases the probability of costly market failures by identifying issues impossible to detect through traditional research methodologies.
What Makes SIS International a Top Beer Taste Testing Partner?
SIS International stands apart as a premier beer taste testing partner through a combination of category knowledge, methodological innovation, and global capabilities. Here’s why leading breweries trust SIS International for their most critical research needs:
- CUSTOMIZED APPROACH: SIS designs beer taste testing protocols specific to your business questions rather than applying one-size-fits-all methodologies.
- 40+ YEARS OF EXPERIENCE: Since 1984, SIS International has conducted beer taste testing across price segments, style categories, and global markets, building unparalleled category expertise.
- THE GLOBAL DATABASES FOR RECRUITMENT: SIS maintains specialized panels of beer consumers across 53 countries, segmented by consumption frequency, style preferences, craft affinity, and category engagement.
- PROJECTS GET DONE FAST: SIS International’s dedicated beer taste testing facilities in key markets enable rapid deployment of research protocols. From initial brief to final report, SIS typically delivers complete projects 42% faster than general market research providers, with express options available for time-sensitive product decisions.
- AFFORDABLE RESEARCH: Despite specialized expertise, SIS International’s efficient methodologies and purpose-built facilities keep beer taste testing accessible for breweries of all sizes. Modular research designs allow brands to select precisely the insights they need without unnecessary components, with pricing typically 25-33% below comparable specialty research providers.
- TECHNOLOGICAL INTEGRATION: SIS International’s beer taste testing incorporates advanced tools including AI-assisted sentiment analysis, facial coding technology, and biometric response measurement—all integrated with traditional sensory evaluation to provide unprecedented insight depth and accuracy.
- ACTIONABLE RECOMMENDATIONS: Unlike firms that simply deliver data, SIS International’s beer category experts translate research findings into clear, specific recommendations that directly address your business objectives.
Frequently Asked Questions About Beer Taste Testing
How is professional beer taste testing different from casual evaluations?
Professional beer taste testing operates in a completely different universe from casual beer ratings or amateur evaluations. The differences are fundamental:
Professional beer taste testing follows strict protocols designed to eliminate variables and bias. Unlike casual tastings, proper beer taste testing controls serving temperature, glassware, pouring method, lighting conditions, and even air quality. It employs trained moderators, often utilizes technologies like facial coding and biometric measurement, and follows standardized evaluation procedures examining appearance, aroma, flavor, mouthfeel, and finish.
What types of business questions can beer taste testing help answer?
Beer taste testing provides critical insights for numerous business decisions including:
- Product development (optimizing recipes before scaling production)
- Line extensions (identifying white space opportunities within your portfolio)
- Competitive positioning (understanding performance relative to key competitors)
- Pricing strategy (determining value perception thresholds)
- Packaging development (evaluating how visual cues affect taste perception)
- Quality assurance (ensuring consistent product experience)
- Shelf-life stability (tracking sensory evolution throughout product lifecycle)
- Target audience refinement (identifying which consumer segments respond most positively)
The methodology is particularly valuable for understanding the crucial “why” behind preference patterns that quantitative research alone can’t reveal. While traditional surveys might show declining sales, only proper beer taste testing can identify whether the issue is flavor drift, packaging perception, or competitive context—each requiring completely different solutions.
How many consumers should participate in beer taste testing for reliable results?
While specific sample sizes depend on research objectives, most professional beer taste testing requires 75-150 participants for directional insights and 150-300 for statistical validation across segments.
However, quality matters more than quantity. A professionally recruited sample of 100 participants from your specific target market will provide far more valuable insights than 300 general consumers with no screening for relevance.
How long does a typical beer taste testing session take?
Most professional beer taste testing sessions run 60-90 minutes, balancing comprehensive evaluation against palate fatigue. Sessions typically include 5-8 beer samples, though this varies based on beer type (higher ABV or more intense flavors like IPAs or imperial stouts limit sample count).
The ideal design includes sufficient time for both initial reactions and extended evaluation as samples warm slightly and open up, plus moderator-led discussion to probe perceptions. Extended sessions (up to 2 hours) may be appropriate for complex research objectives or when including supplemental methodologies like packaging evaluation alongside beer taste testing.
How can beer taste testing improve our chances of market success?
Beer taste testing significantly reduces market risk by identifying potential issues before large-scale production and distribution investments. Research consistently shows properly conducted beer taste testing can increase new product success rates by 35-45% compared to products launched without sensory validation.
Beyond simple preference measurement, beer taste testing reveals crucial gaps between stated opinions and actual reactions, identifies specific product attributes driving both positive and negative responses, evaluates competitive performance in realistic contexts, and provides guidance for targeted refinements rather than complete reformulations.
For breweries, where production scaling represents significant capital investment and failed products damage both finances and reputation, this risk reduction represents enormous potential value—the difference between profitable growth and costly mistakes in an increasingly competitive market.
Unser Standort in New York
11 E 22nd Street, Floor 2, New York, NY 10010 T: +1(212) 505-6805
Über SIS International
SIS International bietet quantitative, qualitative und strategische Forschung an. Wir liefern Daten, Tools, Strategien, Berichte und Erkenntnisse zur Entscheidungsfindung. Wir führen auch Interviews, Umfragen, Fokusgruppen und andere Methoden und Ansätze der Marktforschung durch. Kontakt für Ihr nächstes Marktforschungsprojekt.

